U.S. National Parks — Data Analysis
Lab 9b | Amadeo Prayoga
Original Dataset
The dataset below contains information on all 63 U.S. National Parks, including their location, the date they were established, their total area in square kilometers, and the number of recreation visitors recorded in 2021. Data sourced from Kaggle.
| Park Name | Primary Location | Date Established as Park | Area in km² | Recreation Visitors (2021) |
|---|---|---|---|---|
| Acadia | Maine | February 26, 1919 | 198.6 | 4,069,098 |
| American Samoa | American Samoa | October 31, 1988 | 33.4 | 8,495 |
| Arches | Utah | November 12, 1971 | 310.3 | 1,806,865 |
| Badlands | South Dakota | November 10, 1978 | 982.4 | 1,224,226 |
| Big Bend | Texas | June 12, 1944 | 3,242.2 | 581,220 |
| Biscayne | Florida | June 28, 1980 | 700.0 | 705,655 |
| Black Canyon of the Gunnison | Colorado | October 21, 1999 | 124.6 | 308,910 |
| Bryce Canyon | Utah | February 25, 1928 | 145.0 | 2,104,600 |
| Canyonlands | Utah | September 12, 1964 | 1,366.2 | 911,594 |
| Capitol Reef | Utah | December 18, 1971 | 979.0 | 1,405,353 |
| Carlsbad Caverns | New Mexico | May 14, 1930 | 189.3 | 349,244 |
| Channel Islands | California | March 5, 1980 | 1,009.9 | 319,252 |
| Congaree | South Carolina | November 10, 2003 | 108.0 | 215,181 |
| Crater Lake | Oregon | May 22, 1902 | 741.5 | 647,751 |
| Cuyahoga Valley | Ohio | October 11, 2000 | 131.8 | 2,575,275 |
| Death Valley | California | October 31, 1994 | 13,793.3 | 1,146,551 |
| Denali | Alaska | February 26, 1917 | 19,185.8 | 229,521 |
| Dry Tortugas | Florida | October 26, 1992 | 261.8 | 83,817 |
| Everglades | Florida | May 30, 1934 | 6,106.5 | 942,130 |
| Gates of the Arctic | Alaska | December 2, 1980 | 30,448.1 | 7,362 |
| Gateway Arch | Missouri | February 22, 2018 | 0.4 | 1,145,081 |
| Glacier | Montana | May 11, 1910 | 4,100.0 | 3,081,656 |
| Glacier Bay | Alaska | December 2, 1980 | 13,044.6 | 89,768 |
| Grand Canyon | Arizona | February 26, 1919 | 4,862.9 | 4,532,677 |
| Grand Teton | Wyoming | February 26, 1929 | 1,254.7 | 3,885,230 |
| Great Basin | Nevada | October 27, 1986 | 312.3 | 144,875 |
| Great Sand Dunes | Colorado | September 24, 2004 | 434.4 | 602,613 |
| Great Smoky Mountains | North Carolina | June 15, 1934 | 2,114.2 | 14,161,548 |
| Guadalupe Mountains | Texas | September 30, 1972 | 349.5 | 243,291 |
| Haleakalā | Hawaii | July 1, 1961 | 134.6 | 853,181 |
| Hawaiʻi Volcanoes | Hawaii | August 1, 1916 | 1,317.7 | 1,262,747 |
| Hot Springs | Arkansas | March 4, 1921 | 22.5 | 2,162,884 |
| Indiana Dunes | Indiana | February 15, 2019 | 62.1 | 3,177,210 |
| Isle Royale | Michigan | April 3, 1940 | 2,314.0 | 25,844 |
| Joshua Tree | California | October 31, 1994 | 3,217.9 | 3,064,400 |
| Katmai | Alaska | December 2, 1980 | 14,870.3 | 24,764 |
| Kenai Fjords | Alaska | December 2, 1980 | 2,710.0 | 411,782 |
| Kings Canyon | California | March 4, 1940 | 1,869.2 | 562,918 |
| Kobuk Valley | Alaska | December 2, 1980 | 7,084.9 | 11,540 |
| Lake Clark | Alaska | December 2, 1980 | 10,602.0 | 18,278 |
| Lassen Volcanic | California | August 9, 1916 | 431.4 | 359,635 |
| Mammoth Cave | Kentucky | July 1, 1941 | 218.6 | 515,774 |
| Mesa Verde | Colorado | June 29, 1906 | 212.4 | 548,477 |
| Mount Rainier | Washington | March 2, 1899 | 956.6 | 1,670,063 |
| New River Gorge | West Virginia | December 27, 2020 | 28.4 | 1,682,720 |
| North Cascades | Washington | October 2, 1968 | 2,042.8 | 17,855 |
| Olympic | Washington | June 29, 1938 | 3,733.8 | 2,718,925 |
| Petrified Forest | Arizona | December 9, 1962 | 895.9 | 590,334 |
| Pinnacles | California | January 10, 2013 | 108.0 | 348,857 |
| Redwood | California | October 2, 1968 | 562.5 | 435,879 |
| Rocky Mountain | Colorado | January 26, 1915 | 1,075.7 | 4,434,848 |
| Saguaro | Arizona | October 14, 1994 | 375.8 | 1,079,786 |
| Sequoia | California | September 25, 1890 | 1,635.2 | 1,059,548 |
| Shenandoah | Virginia | December 26, 1935 | 810.1 | 1,592,312 |
| Theodore Roosevelt | North Dakota | November 10, 1978 | 285.1 | 796,085 |
| Virgin Islands | U.S. Virgin Islands | August 2, 1956 | 60.9 | 323,999 |
| Voyageurs | Minnesota | April 8, 1975 | 883.1 | 243,042 |
| White Sands | New Mexico | December 20, 2019 | 592.2 | 782,469 |
| Wind Cave | South Dakota | January 9, 1903 | 137.5 | 709,001 |
| Wrangell–St. Elias | Alaska | December 2, 1980 | 33,682.6 | 50,189 |
| Yellowstone | Wyoming | March 1, 1872 | 8,983.2 | 4,860,242 |
| Yosemite | California | October 1, 1890 | 3,082.7 | 3,287,595 |
| Zion | Utah | November 19, 1919 | 595.9 | 5,039,835 |
Charts & Analysis
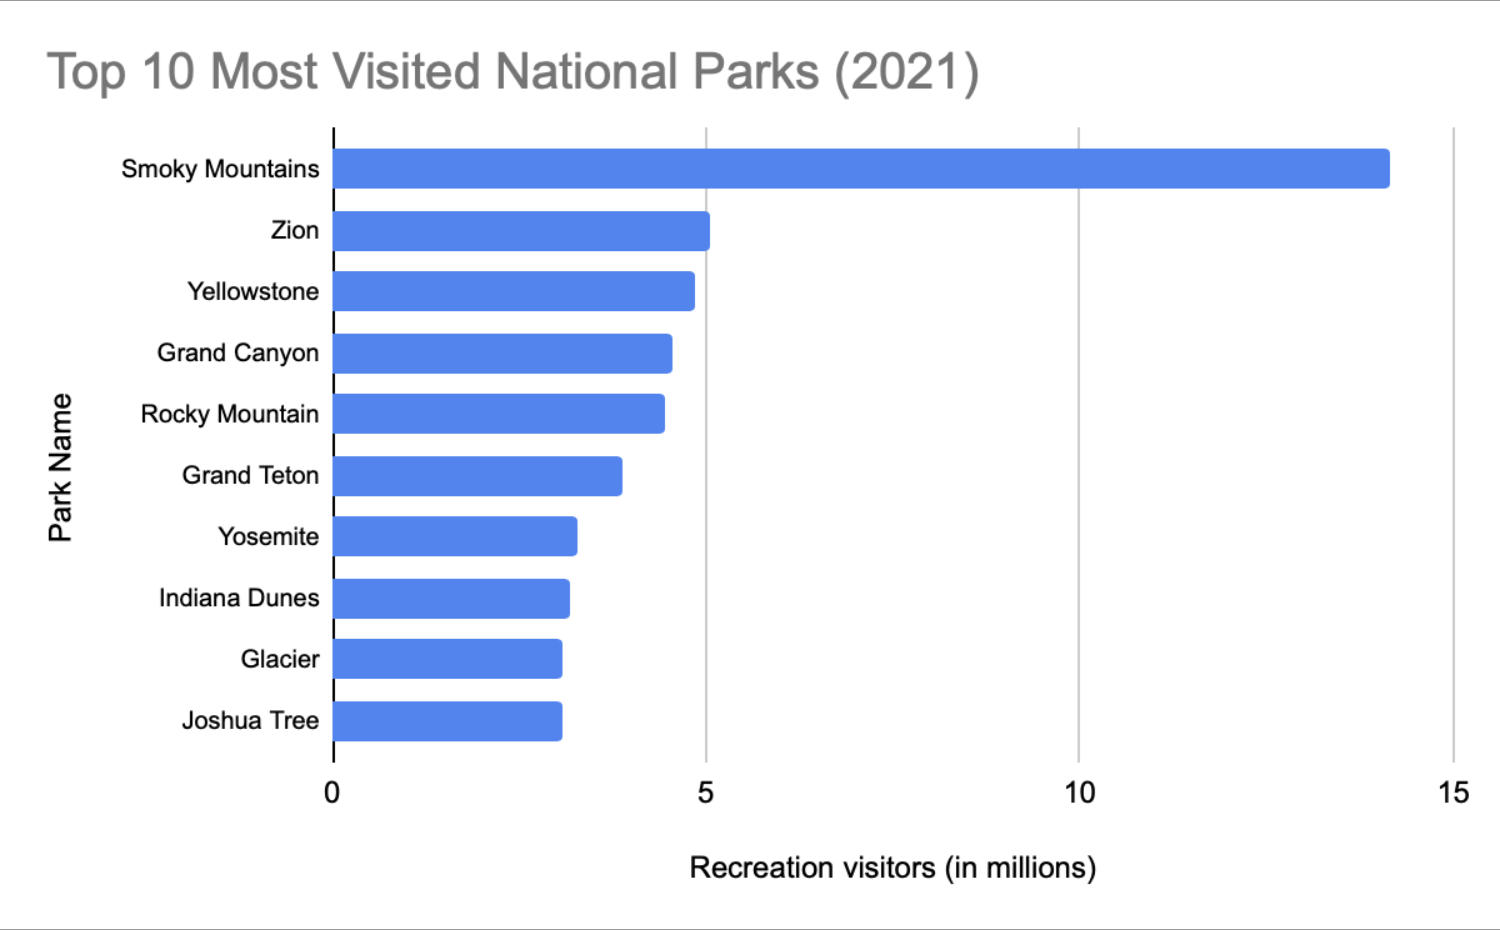
The story here is of dominance and dropoff. Great Smoky Mountains isn't just the most visited park, it's in a category of its own. The park pulls nearly 14 million visitors while the second-place park, Zion, sits at roughly 5 million. That's almost a 3x gap between first and second place.
From Zion downward, the remaining eight parks cluster tightly between 3–5 million, suggesting a fairly competitive middle tier. The deeper argument this chart makes is about accessibility and geography: Smoky Mountains sits within a day's drive of roughly a third of the U.S. population, while parks like Glacier and Joshua Tree require more deliberate travel. Proximity to population centers may be the dominant driver of visitation.
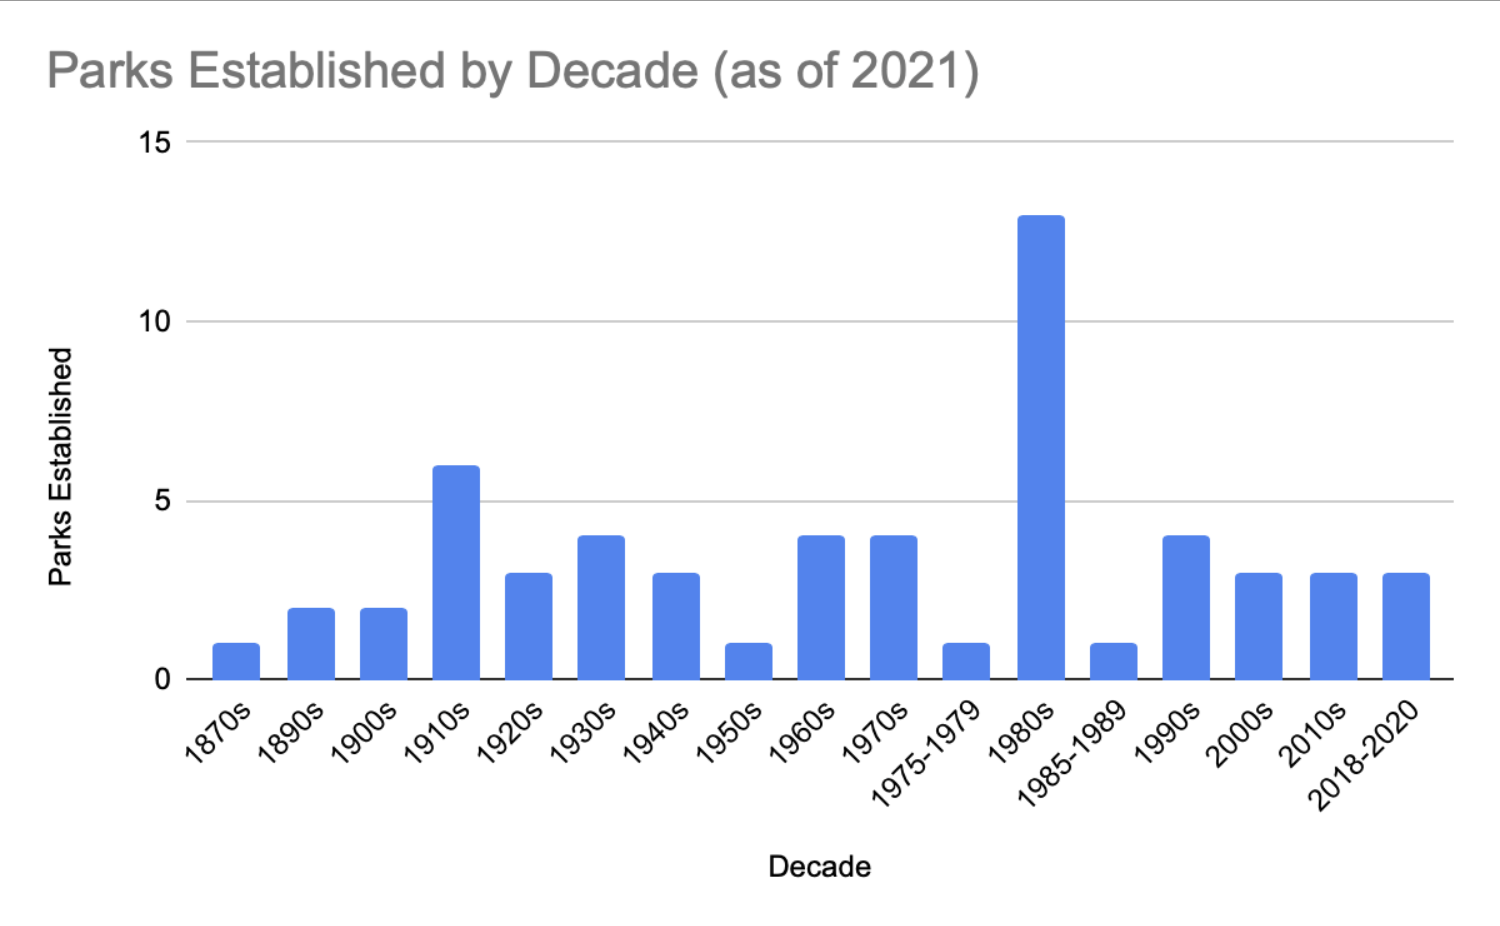
This chart tells a story of two conservation eras separated by decades of relative inaction. The early 1900s–1920s saw the first wave of park creation, driven by the progressive-era conservation movement under presidents like Roosevelt and Wilson. Then activity slowed considerably through the mid-century.
The real story is the 1980s spike. 13 parks in a single decade. This corresponds almost entirely to the Alaska National Interest Lands Conservation Act of 1980, a single piece of legislation that created or expanded a massive number of Alaskan parks at once. Without that legislative event, the 1980s bar would look unremarkable. The recent 2018–2020 cluster hints at a modest third wave, though it is too early to call it a trend.
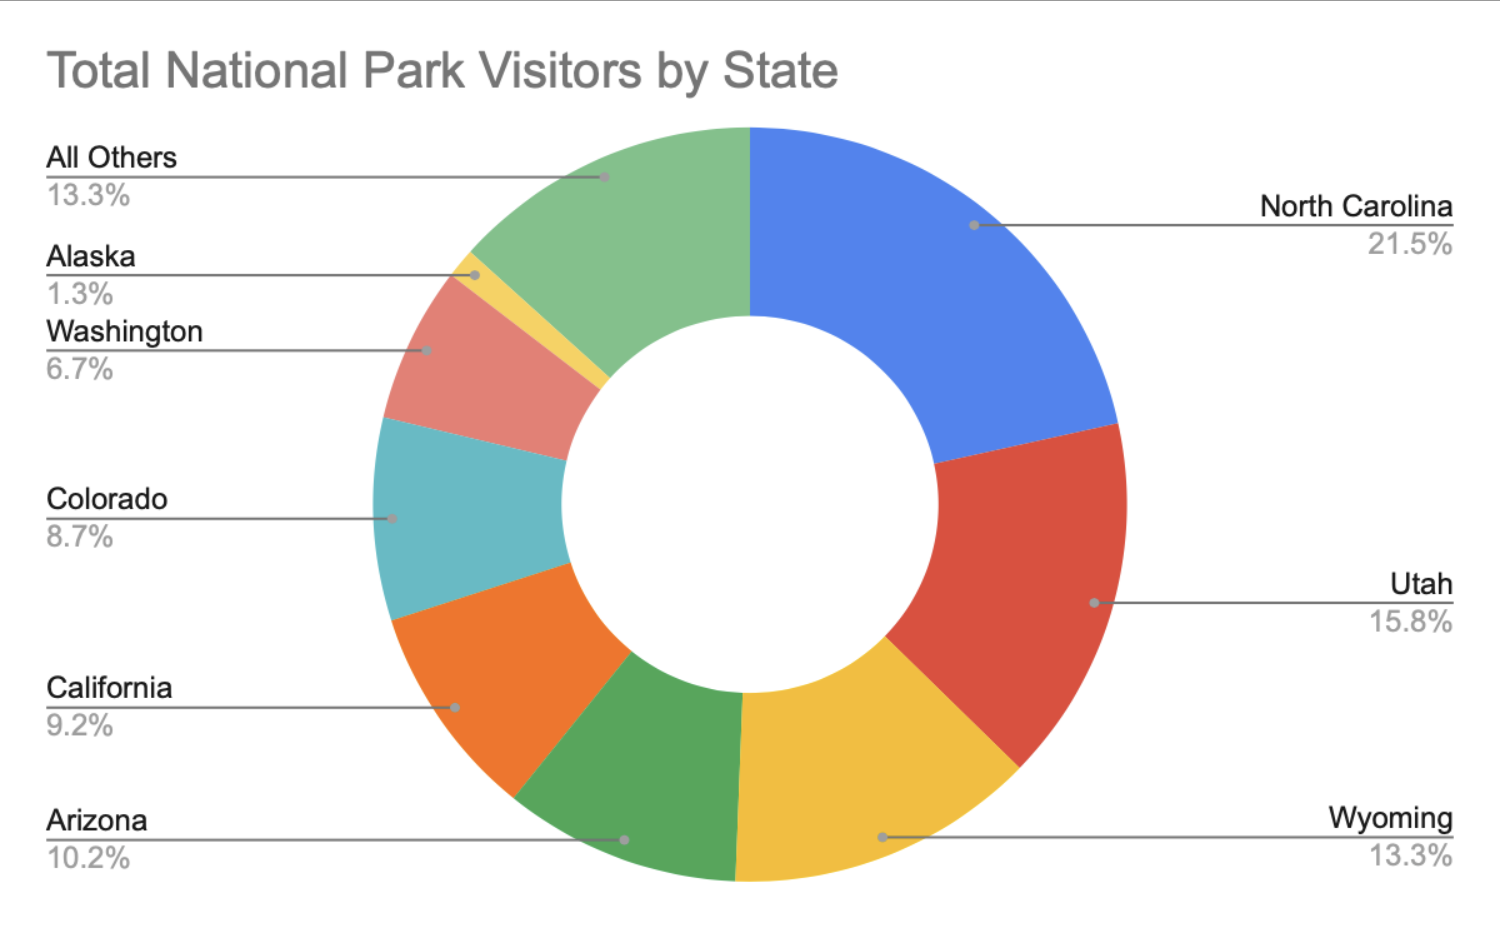
The central argument of this donut chart is geographic concentration. Just four states: North Carolina (dominated by Great Smoky Mountains), Utah, Wyoming, and Arizona account for over 60% of all national park visits nationally.
This raises an important tension: the parks with the most visitors tend to be in states with relatively few parks, meaning visitation is heavily skewed by one or two flagship parks per state rather than being spread across many. California and Colorado, which have numerous parks each, still trail North Carolina despite their larger park counts — reinforcing the Smoky Mountains outlier effect seen in Chart 1. The "All Others" slice at 13.3% is also striking: it represents the combined total of all remaining states and territories, suggesting that most of America's national park land receives a disproportionately small share of human attention.